Reports & insights
Turn driving data into lower costs
Mileage, fuel usage, and harsh-driving reports show you exactly where money and safety are being lost — by vehicle, by site, by date range.
7/30-day or custom rangePer-vehicle filteringDaily trend charts
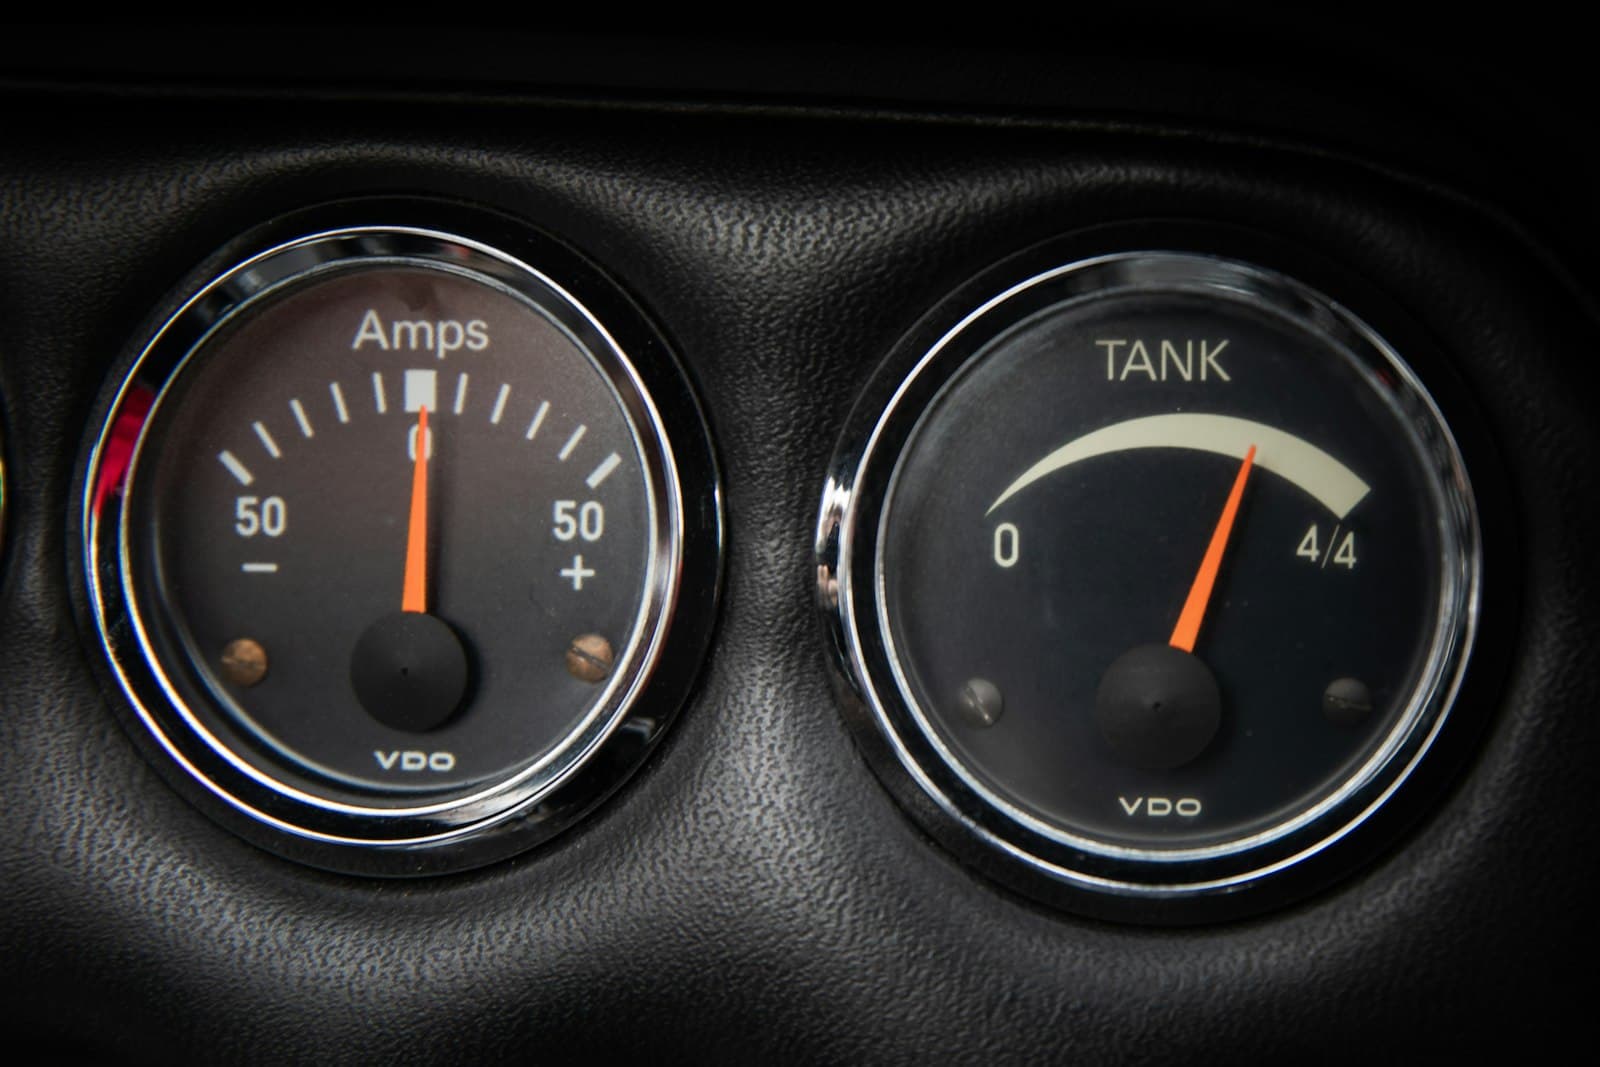
Fleet reports · 7 days
Distance
2,140 km
Fuel used
312 L
Mileage & fuel
See exactly where fuel is going
Pick any date range and see distance driven and fuel used, broken down by vehicle — spot fuel waste before it adds up across your fleet.
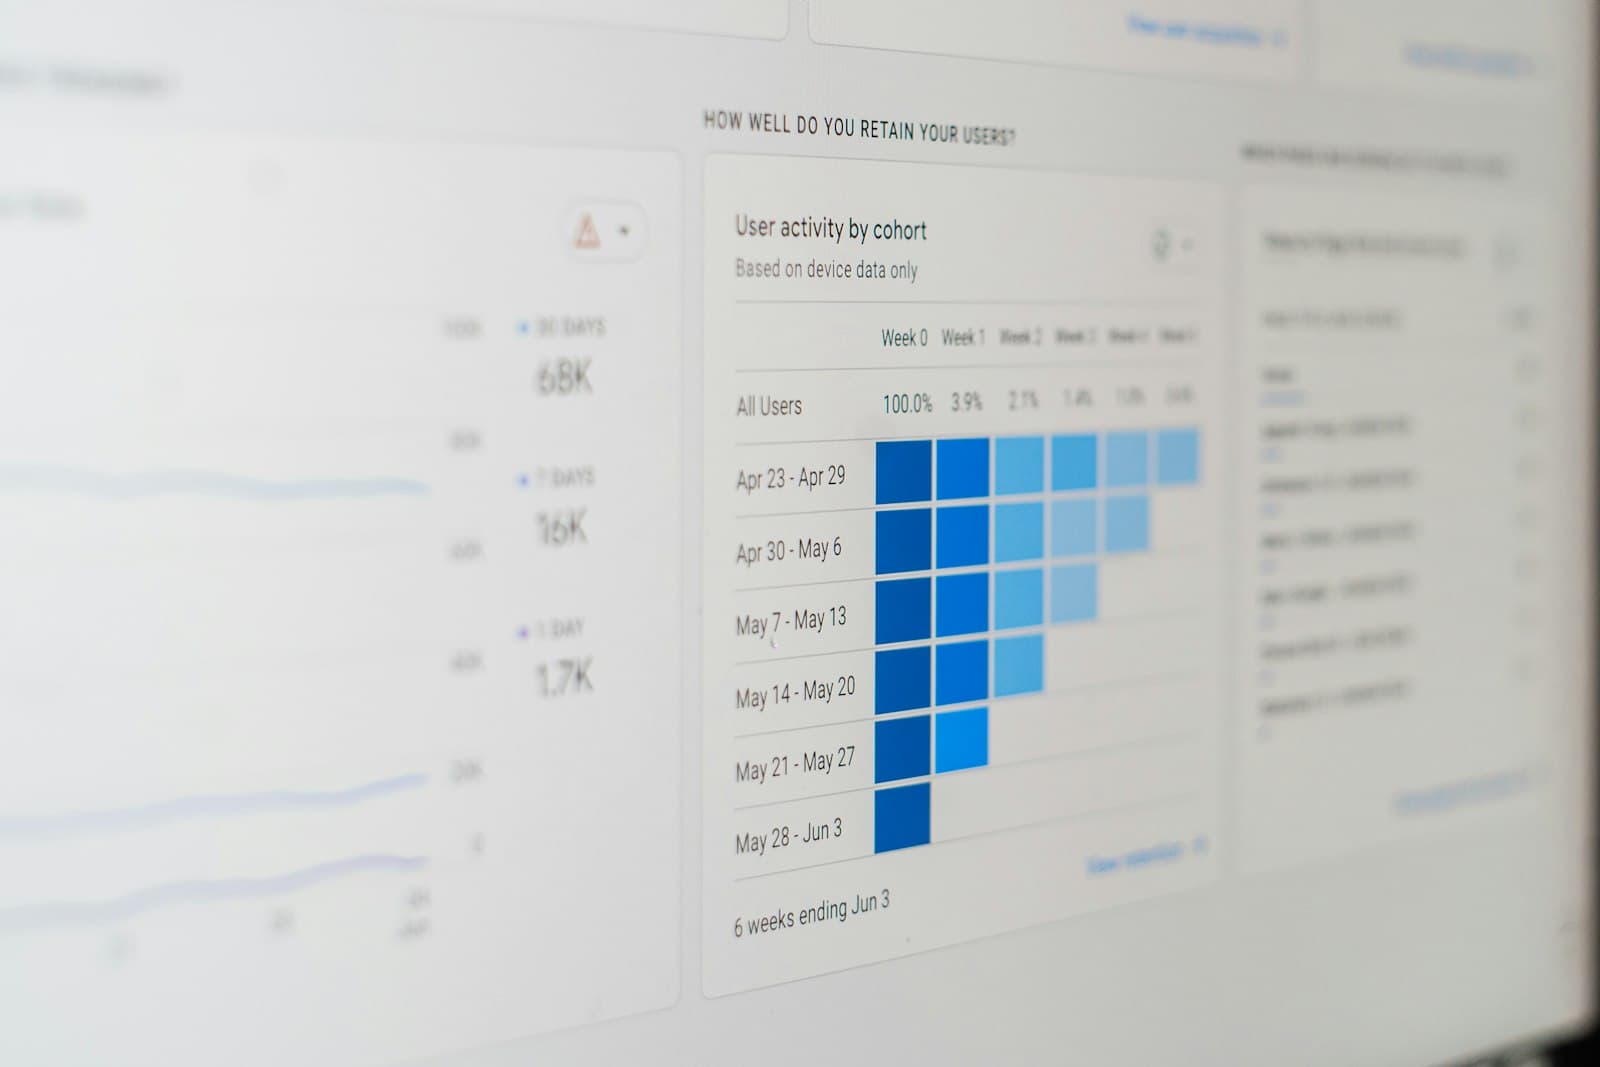
Driving behavior
Harsh-event trends, not just totals
Daily trend charts for distance, fuel, and harsh-driving events for any date range up to 31 days — watch the numbers move day by day instead of waiting for a monthly summary.
FAQs
Here to help
Still have questions?
We know fleet software can feel complex. Book a personal demo with an Opilote specialist and we'll walk you through it, live.
Book a demo